Ready to become an N.Rich AI builder and get paid for it?
The buildable ABM platform The buildable ABM platform that drives pipeline everyone can trust


Recognized in the 2026 Gartner® Magic Quadrant™ for ABM Platforms*
The flexible ABM platform that:
- enables marketers to scale campaigns
- gives revenue leaders deep visibility into pipeline
- finds the accounts heating up and prepares the sales team
- proves marketing's number to the board
- pushes the target list into HubSpot
- briefs the rep before the call
Recognized in the 2026 Gartner® Magic Quadrant™ for ABM Platforms*


MARKETING PLATFORM
Drive ABM results
your CEO can’t ignore
Recognized in the 2026 Gartner® Magic Quadrant™ for ABM Platforms*












What is N.Rich?
N.Rich is an ABM platform. It finds the accounts that are ready to buy, puts your ads in front of them, and builds the apps your team works from.
-
Find the accounts that are buying
ABM platform. Build your ICP from 30+ data points, or sync your own account lists from HubSpot or Salesforce. Intent data and website visits show which accounts are in market. Workflows keep each segment up to date.
-
Reach them with ABM ads
ABM ads. Run ads in four formats across tens of millions of websites: article, video, cross-channel and image display. Only your target accounts see them. You pay only when someone engages.
-
Act on it with apps
N.Rich AI. Describe a job in one sentence, and N.Rich AI builds the app. Publish the app to HubSpot or Salesforce, so your sales team sees it where they already work.
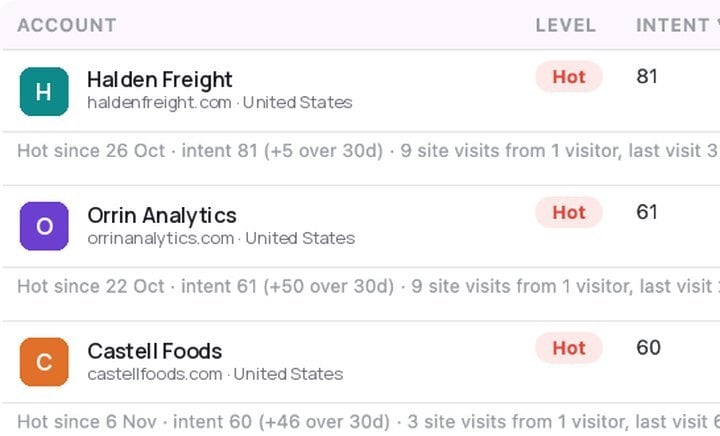
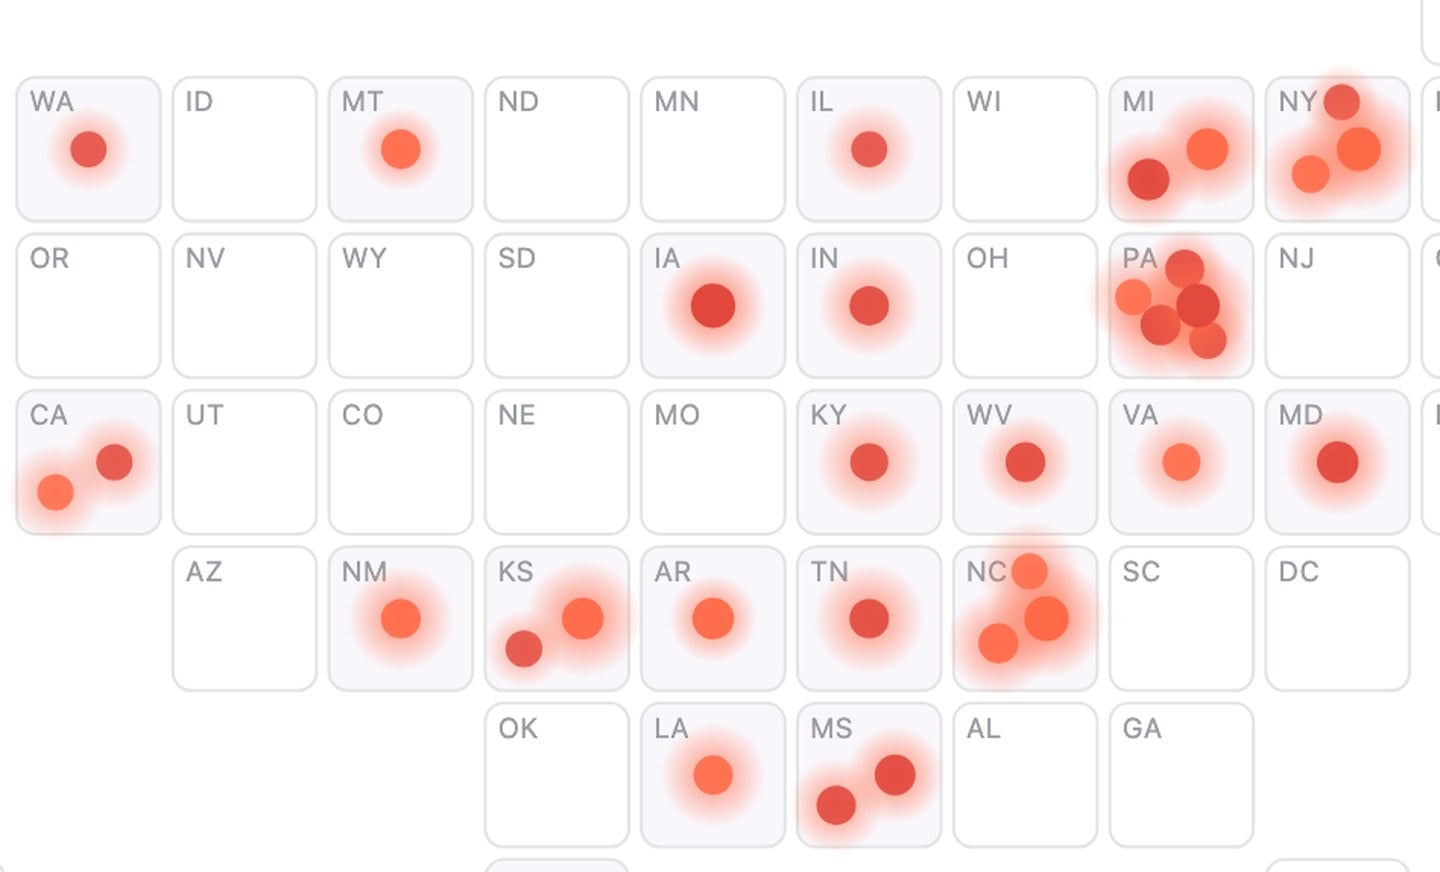
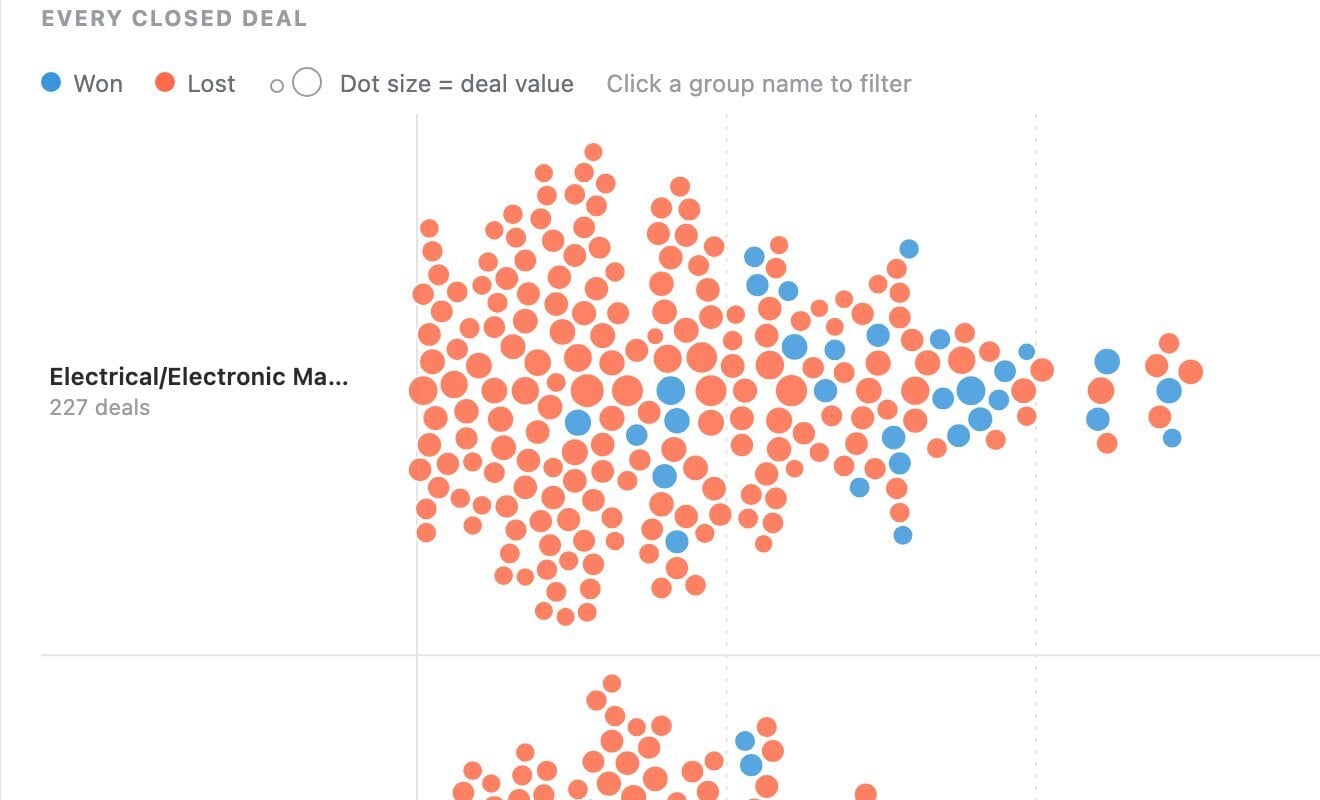

Every app runs on the same reliable data
Everything comes from the same sources, matched to the same company records and read with your own definitions. No conflicting numbers, no rogue accounts, no "where is this signal coming from?".
-
 Data foundation. You bring your CRM records, ad touches, and sales notes. We add what you cannot collect yourself: identified website visitors, our own intent signals, and ad engagement from our own DSP.
-
 Interpretation and scoring. N.Rich matches and enriches every account, then scores it against your own ICP definition and funnel stages, so a recent visit from a Tier 1 account surfaces as a priority for sales.
-
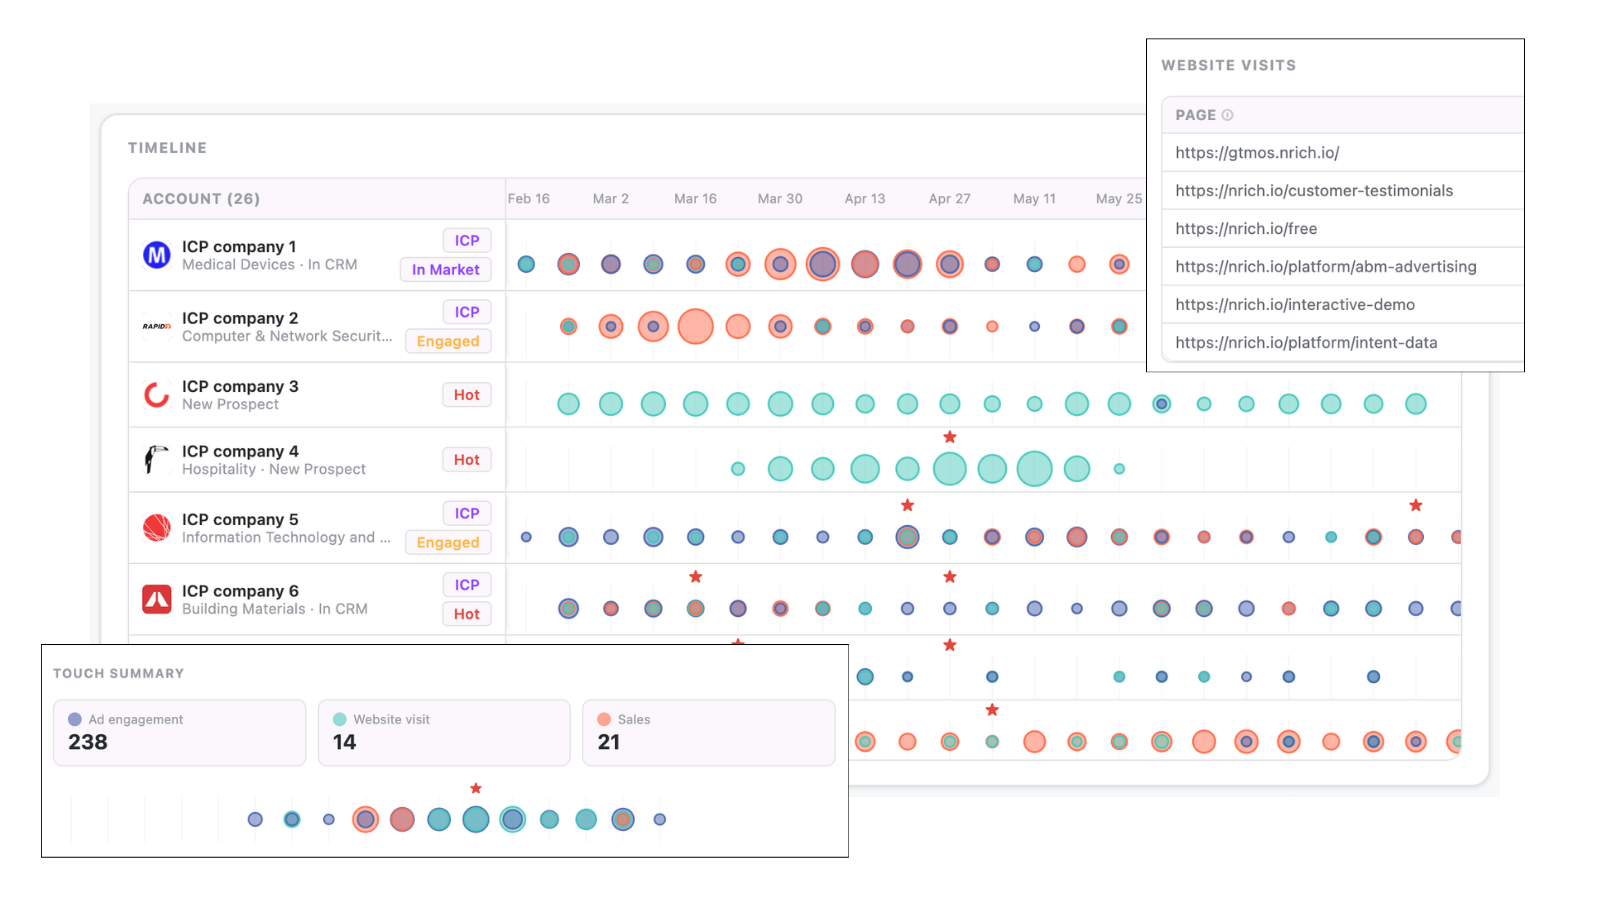
 Interaction. Ask for what you need in plain language and see it in whatever shape answers the question: a ranked list, a timeline, overlapping segments, a weekly trend. Need a different view? - Just ask again.
-
 Action. The next move is always one click away: build a segment, launch a campaign, notify the account owner, write the score back to your CRM, or export it. Act from inside the app.
N.Rich vs. your own AI setup
"I could wire this up myself in Claude" - fair enough, and the first version usually works. But then it gets expensive.
We keep your data joined and read the same way every time, keep it compliant and secure, and stop you paying a model to clean it up.
YOUR OWN AI SETUP
N.RICH AI
YOUR OWN AI SETUP
Seven exports that disagree on who a company is
N.RICH AI

One company record, resolved once and reused
YOUR OWN AI SETUP
The model guesses what your deal stages mean
N.RICH AI
Your own definitions, applied consistently
YOUR OWN AI SETUP
Missing data gets filled in with a guess
N.RICH AI

Gaps get flagged proactively during the build
YOUR OWN AI SETUP
Your customer data goes into someone else's AI
N.RICH AI

Your data stays in a platform built for it
YOUR OWN AI SETUP
Nothing's certified, so you vouch for it
N.RICH AI
SOC 2 and ISO certified, GDPR compliant
YOUR OWN AI SETUP
When it breaks, you're the one fixing it
N.RICH AI
Ours to fix, with a support agreement
YOUR OWN AI SETUP
Half your tokens re-stitch the same data
N.RICH AI

Tokens go on answers, not on plumbing
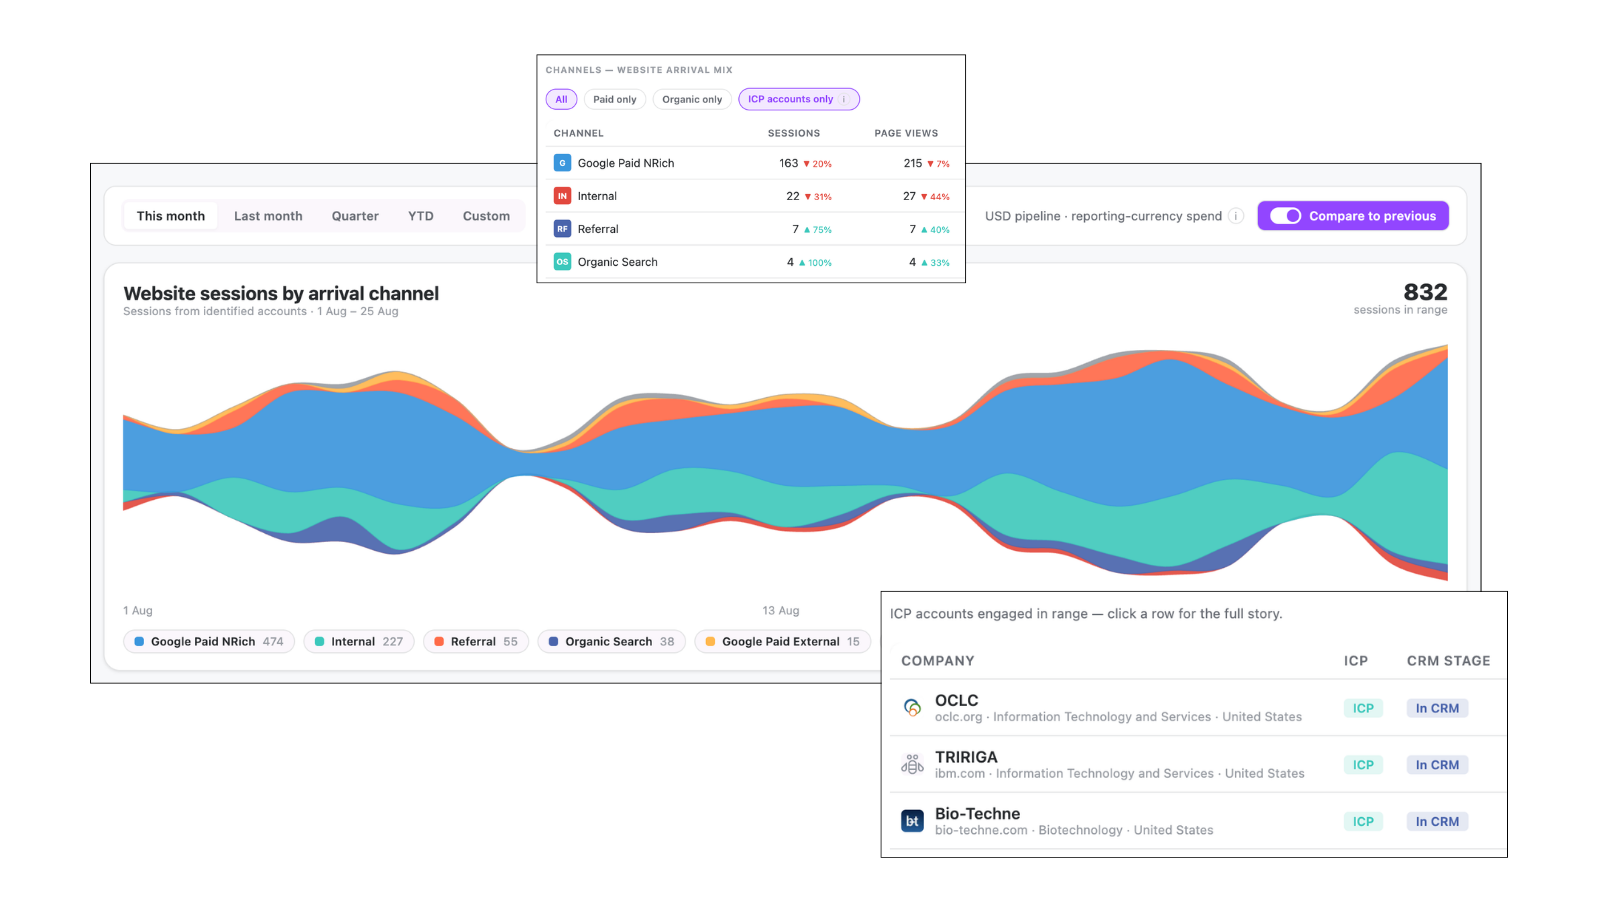
"Which companies are visiting our website? Are they our ICP?"
"Which accounts should I call right now?"
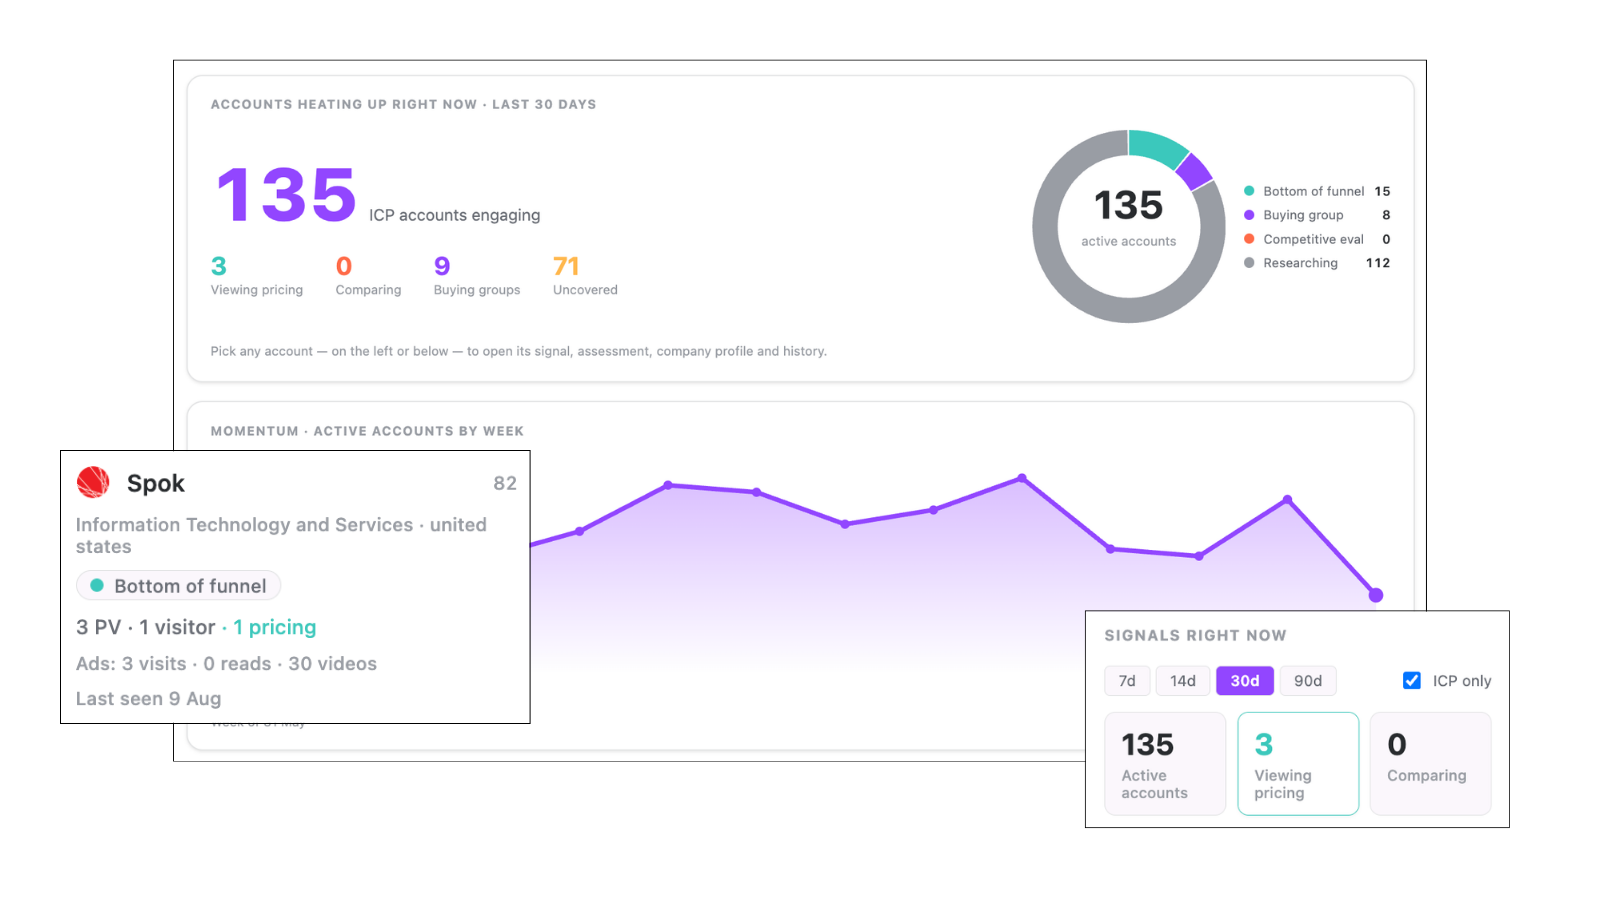
"How are our ABM campaigns performing?"
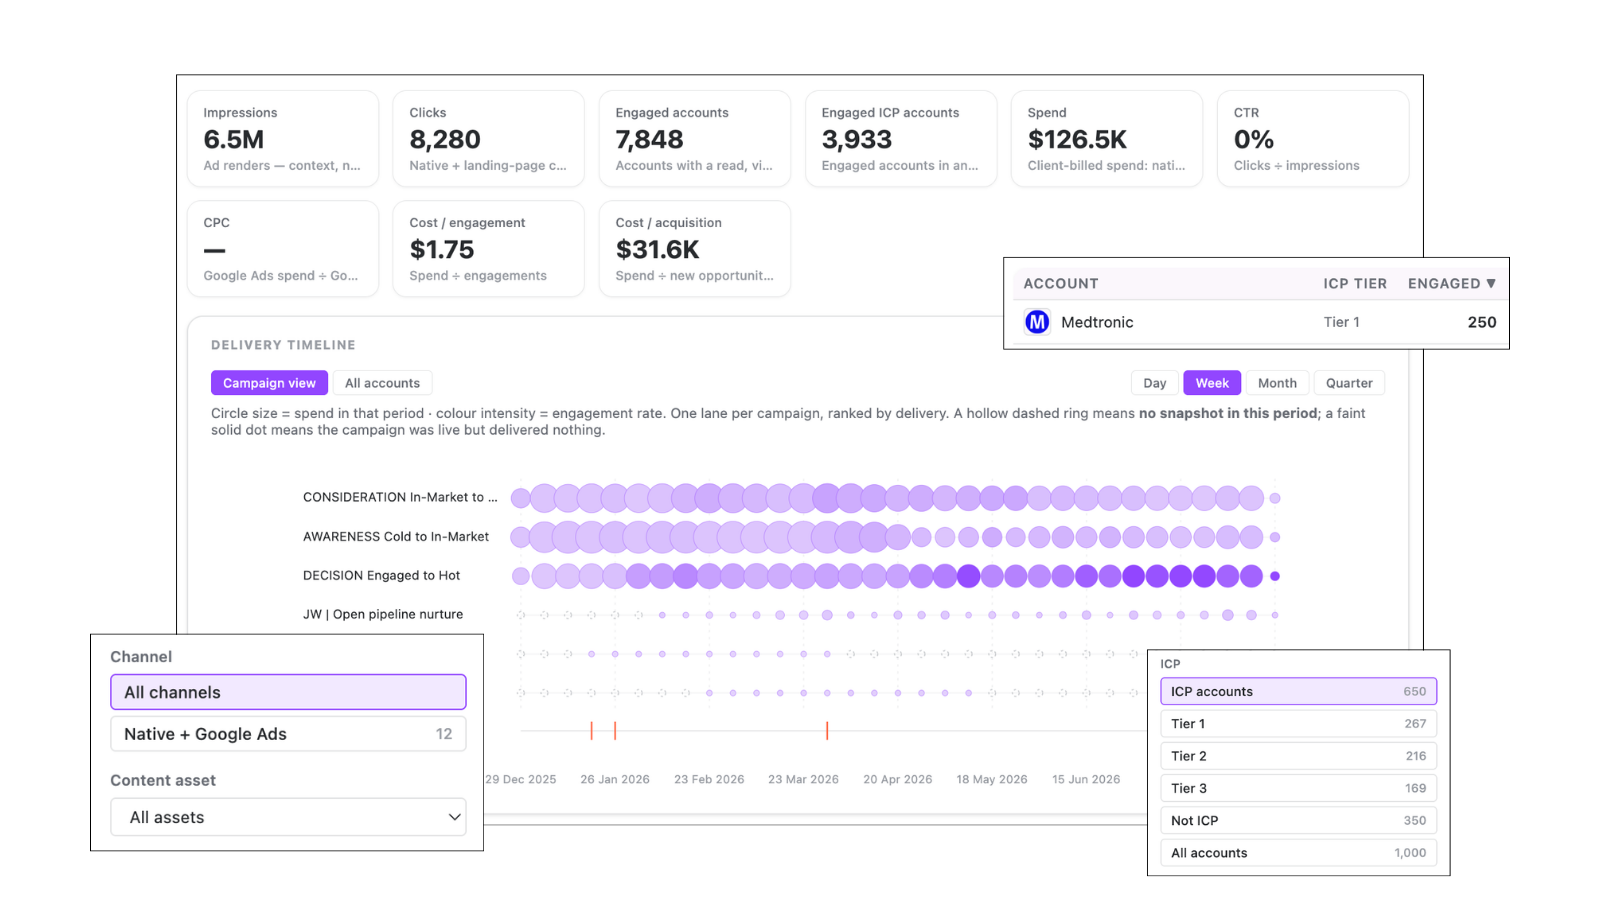
"Which channels actually drive closed won deals?"
analysts worldwide

Recognized in the 2026 Gartner® Magic Quadrant™ for ABM Platforms
Gartner, Magic Quadrant for Account-Based Marketing Platforms, 7 October 2026. Magic Quadrant is a trademark of Gartner, Inc. and/or its affiliates.
Gartner does not endorse any company, vendor, product or service depicted in its publications, and does not advise technology users to select only those vendors with the highest ratings or other designation. Gartner publications consist of the opinions of Gartner’s business and technology insights organization and should not be construed as statements of fact. Gartner disclaims all warranties, expressed or implied, with respect to this publication, including any warranties of merchantability or fitness for a particular purpose.
Hear from our customers

10x Conversion to opportunity for ICP accounts
Virta used N.Rich to build an ICP model increasing account-to-opportunity conversion by 10X and opportunity win rates by 6X...
Learn more
270% Improved win rate
EHS Insight improved win rates for key accounts by 270% by introducing the mixbound model...
Learn more
40% Higher conversion to SQL
Powell Software grew account-to-SQL conversion by 40% after N.Rich campaigns...
Learn more
Up to 316% higher sales velocity
NFON accelerated pipeline, reaching up to 316% higher sales velocity with N.Rich ABM.
Learn more
360-degree view of the key accounts
AutoStore built a 360-degree view of its key accounts with N.Rich, sharpening targeting across the funnel.
Learn more
590 in-market ICP accounts engaged
Winningtemp engaged 590 in-market ICP accounts and influenced €39K in pipeline with N.Rich.
Learn more
Dorothea Gam
CMO
Mouseflow
"It has made our work as marketers significantly easier, especially in moving each lead seamlessly through the different stages of the marketing funnel. Automation removes the need for manual lead progression through the funnel, saving time and reducing errors. The support and customer success teams are a pleasure to work with."

Samuli Ahola
Director of digital sales and marketing
VIRTA
"Results are really good. We generated €13 million in created pipeline and roughly €1.3 million in closed sales influenced by ABM campaigns run through N.Rich. Account-based advertising definitely has an impact especially when you have this joint effort between sales and marketing. That is when you know exactly which companies you're going after."
Test N.Rich with
your own data
Find out how many of your ideal customers already researching you or your competition and turn the insight into an action plan to convert them into pipeline!
