What is the pipeline waterfall app?
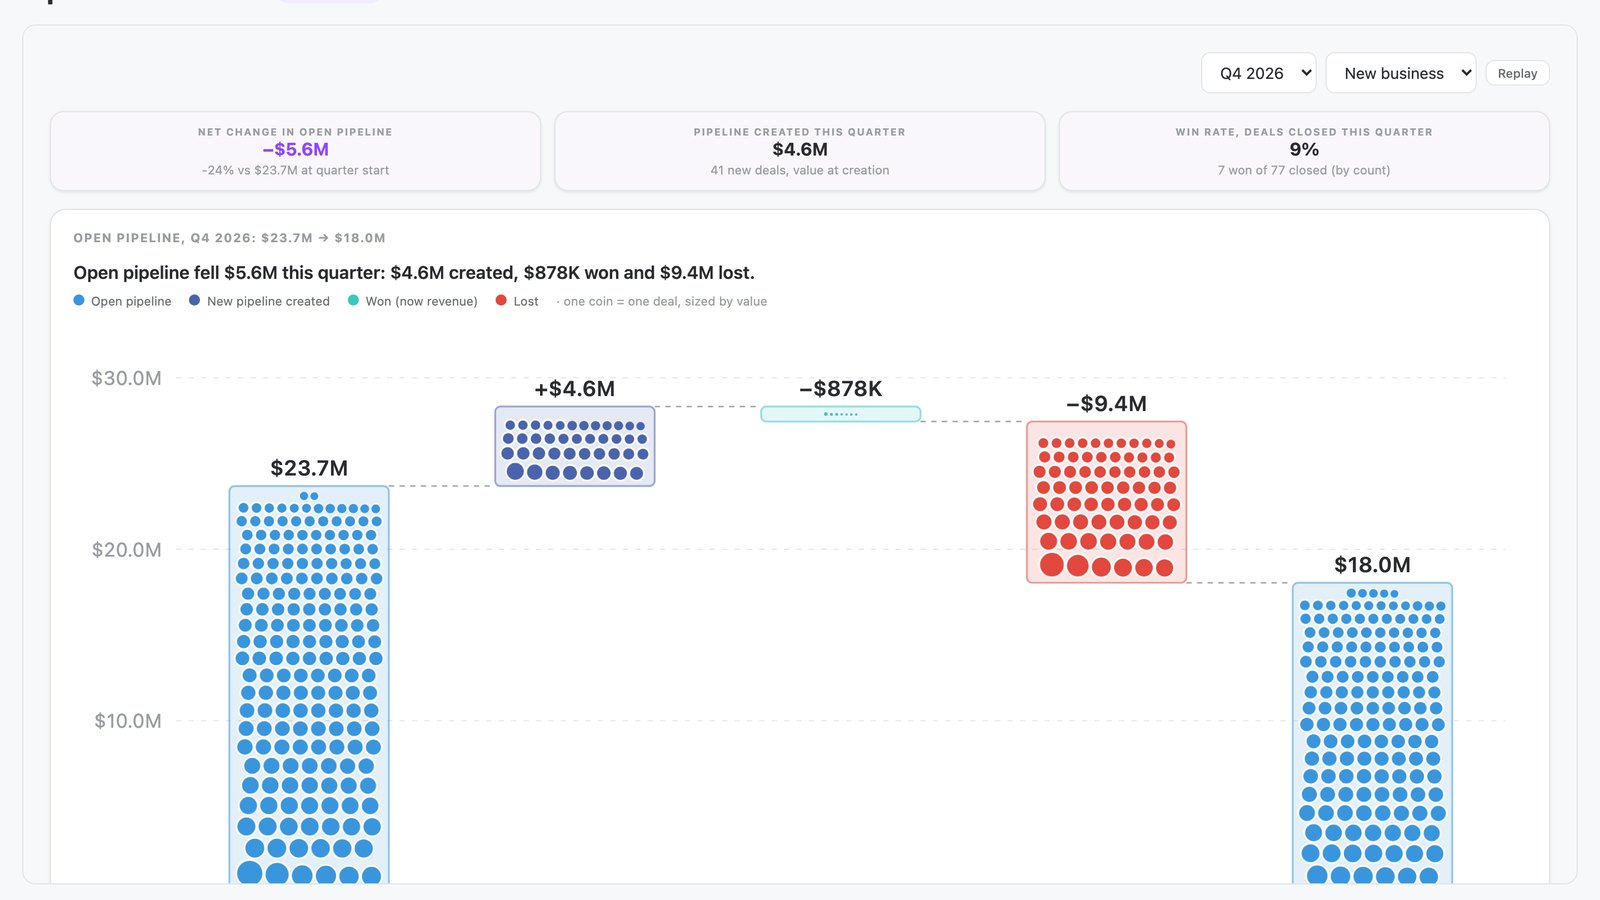
The pipeline waterfall app is a shared N.Rich AI app that shows why open pipeline changed in a quarter. It draws a waterfall from open pipeline at the start of the quarter to open pipeline today. Each step fills with one coin for every deal, sized by value.
Opens the live app on demo data. No sign-up needed. On your own N.Rich account, it reads accounts and deals from HubSpot or Salesforce.
- A waterfall chart A bridge from open pipeline at the start of the quarter to open pipeline today.
- Deal coins Each deal is a coin inside its step, sized by value. Click a step to list its deals.
- Headline numbers Net change in open pipeline, pipeline created this quarter and win rate on deals closed this quarter.
- Built for
- Marketing, Leadership, RevOps
- Category
- Pipeline & revenue
- Reads from
- N.Rich and your CRM (HubSpot or Salesforce)
- Built by
- N.Rich
- Cost
- Free on demo data. No credit card.
What questions does the pipeline waterfall app answer?
What is a pipeline waterfall?
A pipeline waterfall is a bridge chart that starts with open pipeline at the beginning of a period. It adds or subtracts each change, such as new pipeline, wins and losses, to reach open pipeline at the end. Leaders use it to explain what moved the total. The pipeline waterfall app draws one for the quarter you choose.
In the app: The whole appHow can I explain to the board why pipeline changed this quarter?
Show each change between opening and closing pipeline as its own step: new pipeline, value changes, wins and losses. Add one sentence that states the net movement. Boards then see the drivers behind the total. The pipeline waterfall app draws a waterfall from open pipeline at the start of the quarter to open pipeline today. A one-sentence story above the chart says how pipeline moved.
In the app: Waterfall chartHow do I show how much pipeline we created, won and lost?
Give each outcome its own step in the bridge and show the value of the deals behind it. Created, won and lost pipeline then read as separate numbers that add up to the total. Finance and marketing can check each figure. In the pipeline waterfall app, each deal is a coin, and a click on a step lists its deals.
In the app: Waterfall stepsHow do I measure win rate on deals closed in a quarter?
Divide the deals you won by all the deals you closed in the quarter, won and lost. Use the same rule every quarter so results stay comparable. Win rate next to net pipeline change gives leaders a quick read on the quarter. The pipeline waterfall app shows win rate on deals closed this quarter as one of three headline numbers.
In the app: Headline numbersWhat should I look for in pipeline waterfall reporting?
Look for a chart that reconciles opening and closing pipeline, lets you open the deals behind each step and covers the quarter you choose. A chart that reconciles lets finance and marketing agree on the numbers. The pipeline waterfall app lets you choose the quarter and the pipeline, hides steps worth $0 and lists the deals behind each step.
How can I see which account owner drove a pipeline change?
Repeat the same waterfall for each account owner on one shared scale. Owners can then be compared at a glance, and any step can be opened to list its deals. This shows leaders where the change came from. The pipeline waterfall app repeats the waterfall for each account owner under the main chart, on one scale.
In the app: Owner waterfalls under the main chart
What data does the pipeline waterfall app use?
From your CRM HubSpot or Salesforce
| Source | What the app reads | Where you see it |
|---|---|---|
| CRM deals | Each deal's value, stage, region, account owner, created date and closed date | Coins, step deal lists and owner waterfalls |
| CRM deal value changes | Net edits to deal values during the quarter | Value changes step in the waterfall |
In the playground, every source holds demo data.
How does it work?
- You write one prompt, shown below. A one-sentence story above the chart says how open pipeline moved in the quarter.
- The waterfall runs from open pipeline at the start of the quarter to open pipeline today. Steps show new pipeline created, value changes on deals, won and lost. Steps worth $0 are hidden. Deals carry no close-date history, so the app leaves out a pushed-past-the-quarter step.
- Each deal is a coin inside its bar, sized by value. Won is mint and lost is red. You click a step to list its deals with value, stage, region and account owner.
- Under the main chart, the same waterfall repeats for each account owner on one scale. The prompt asks for a split by region. All demo deals sit in one region, so the app splits by owner.
- Three headline numbers show net change in open pipeline, pipeline created this quarter, and win rate on deals closed this quarter. You choose the quarter and the pipeline, and a replay button redraws the coins.
The prompt that built it
Prompt
I'm the CMO preparing the quarterly board update, and the board always asks why pipeline changed. Build me a 'Pipeline waterfall' app. Lead with a waterfall chart that runs from open pipeline at the start of the quarter to open pipeline today, with separate steps for new pipeline created, won, lost, pushed past the quarter, and value changes on existing deals. If the data can't tell me when a close date moved, show open deals with a close date already in the past as an 'overdue' step instead. When the app loads, build the steps left to right, with each step filling up from the individual deals that make it, shown as coins dropping into the bar, sized by value. Clicking a step lists the deals behind it with value, stage, region and owner. Under the main chart, show the same waterfall for each region side by side, so I can see which region drove the change. Add three headline numbers: net change in pipeline, pipeline created this quarter, and win rate on deals closed this quarter. Let me choose the quarter.
Change the prompt to fit your team, then build your own in the N.Rich AI playground. Build your own
Before you start
Is it free?
Yes. Every app runs free in the N.Rich AI playground on demo data. You do not need a credit card.
Do I need my own data?
No. The playground runs on a demo dataset, so you can try the app before you connect your own data.
Which CRMs does it work with?
On your own N.Rich account, apps read accounts and deals from HubSpot or Salesforce.
Can I change it?
Yes. Ask N.Rich AI to add a column, change a filter or focus on one segment, and it rebuilds the app.