What is the win/loss analysis app?
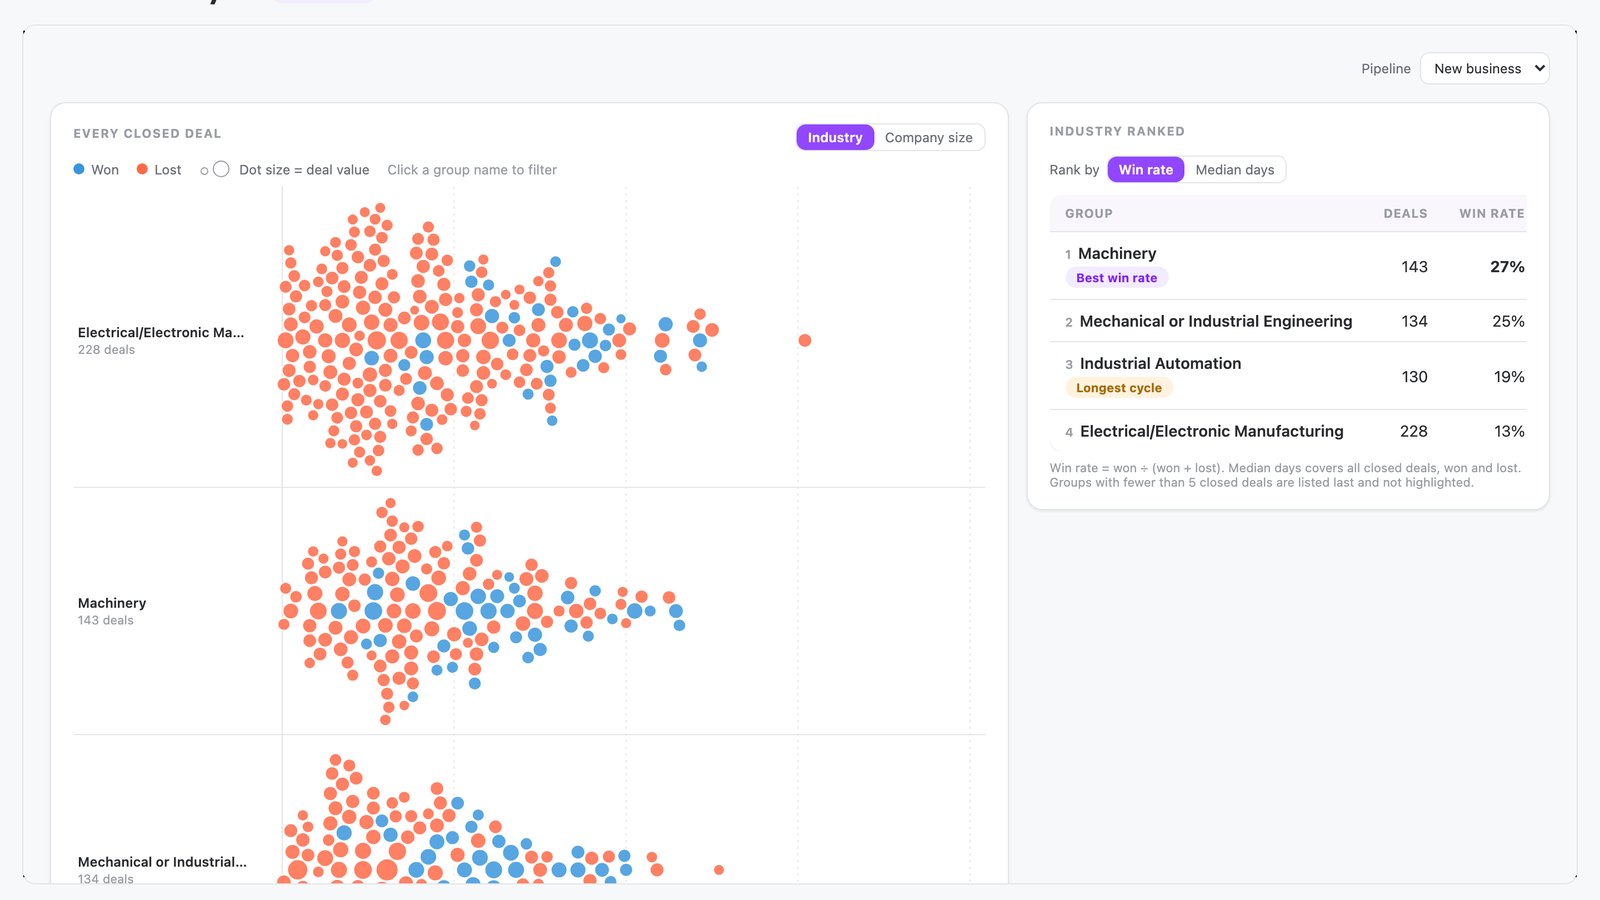
The win/loss analysis app is a shared N.Rich AI app that plots every deal closed in the last 12 months as its own dot. Position shows days from created to closed, size shows deal value, and color shows won or lost. You group the dots by industry or company size.
Opens the live app on demo data. No sign-up needed. On your own N.Rich account, it reads accounts and deals from HubSpot or Salesforce.
- A dot for every deal Position shows days from created to closed. Size shows deal value. Color shows won or lost.
- Ranked groups A ranked list orders each group by win rate or median days to close.
- Headline numbers and a table Overall win rate, median days to close for won deals and value lost at the final stage, plus a closed deals table with CSV export.
- Built for
- Marketing, Sales, Leadership
- Category
- Pipeline & revenue
- Reads from
- N.Rich and your CRM (HubSpot or Salesforce)
- Built by
- N.Rich
- Cost
- Free on demo data. No credit card.
What questions does the win/loss analysis app answer?
What is win/loss analysis?
Win/loss analysis compares won and lost deals to show where a team wins and where it loses. It looks at days to close, deal value and group, such as industry or company size. The comparison tells ABM and sales teams where to focus. The win/loss analysis app plots each deal closed in the last 12 months as its own dot.
In the app: The whole appHow do I find out where we win and where we lose deals?
Group your closed deals by industry or company size and compare the outcomes in each group. Patterns show where a team wins often and where it loses time. An ABM team can then aim its target list at the best-fit accounts. The win/loss analysis app shows every closed deal as a dot, colored won or lost, and groups the dots by industry or company size.
In the app: Deal dot chartWhich industry or company size has the best win rate?
Rank each industry or company size group by win rate, which is won deals divided by won plus lost deals. The best-winning groups show an ABM team where to build target lists. Small groups can mislead, so read them with care. The win/loss analysis app ranks each group, highlights the best win rate and lists groups with fewer than 5 closed deals last.
In the app: Ranked listHow do I measure how long it takes to win a deal?
Measure the days from deal creation to close for won deals, and take the median. Cycle length shows how far ahead an ABM team must start engaging an account. Comparing groups shows which segments move fastest. The win/loss analysis app shows median days to close for won deals as a headline number. Its ranked list can also order groups by median days to close.
In the app: Median days to close headline numberWhat should I look for in win/loss analysis software?
Look for software that shows every closed deal and groups results by account traits such as industry and size. It should let you open the deals behind each group. Visible deals let a team check each pattern against the deals behind it. The win/loss analysis app plots every closed deal as a dot, filters the page by group and exports a closed deals table to CSV.
How do I measure how much deal value we lose at the final stage?
Total the value of lost deals by the last stage they reached. Late-stage losses show where deals fall away after the most sales effort. Reviewing them helps an ABM team learn which accounts looked right and still did not buy. The win/loss analysis app shows value lost at the final stage as a headline number, using the stage each lost deal reached in your CRM.
In the app: Value lost at the final stage headline number
What data does the win/loss analysis app use?
From your CRM HubSpot or Salesforce
| Source | What the app reads | Where you see it |
|---|---|---|
| CRM deals | Each closed deal's created date, closed date, value, outcome and the stage a lost deal reached | Deal dots, headline numbers and the closed deals table |
| CRM accounts | Industry and company size for each account | Grouping of the dots by industry or company size |
In the playground, every source holds demo data.
How does it work?
- You write one prompt, shown below. The app plots every deal closed in the last 12 months as one dot.
- Position across the chart is days from created to closed. Dot size is deal value, and color shows won or lost.
- You group the dots by industry or company size, and the dots move to their new groups when you switch. The prompt also asks for a region grouping. All demo deals sit in one region, so the app offers industry and company size.
- A ranked list orders each group by win rate or median days to close. It highlights the best win rate and the longest cycle. You click a group name to filter the page.
- Three headline numbers show overall win rate, median days to close for won deals, and value lost at the final stage. A closed deals table has filters and a CSV export.
The prompt that built it
Prompt
I'm the CMO, and I want to know where we win and where we waste sales time. Build me a 'Win/loss analysis' app for deals closed in the last 12 months. Lead with a chart that shows every closed deal as its own dot: position across the chart is days from created to closed, size is deal value, and colour is won or lost. Let me group the dots by industry, company size or region, using whichever exist in our data, and have the dots fly to their new groups when I switch, so I can watch the pattern form. Hovering a dot shows the account, value, days to close and the stage a lost deal reached. Beside the chart, rank each group by win rate and median days to close, and highlight the best win rate and the longest cycle. Add three headline numbers: overall win rate, median days to close for won deals, and value lost at the final stage. Clicking a group filters everything else.
Change the prompt to fit your team, then build your own in the N.Rich AI playground. Build your own
Before you start
Is it free?
Yes. Every app runs free in the N.Rich AI playground on demo data. You do not need a credit card.
Do I need my own data?
No. The playground runs on a demo dataset, so you can try the app before you connect your own data.
Which CRMs does it work with?
On your own N.Rich account, apps read accounts and deals from HubSpot or Salesforce.
Can I change it?
Yes. Ask N.Rich AI to add a column, change a filter or focus on one segment, and it rebuilds the app.