What is the CMO dashboard app?
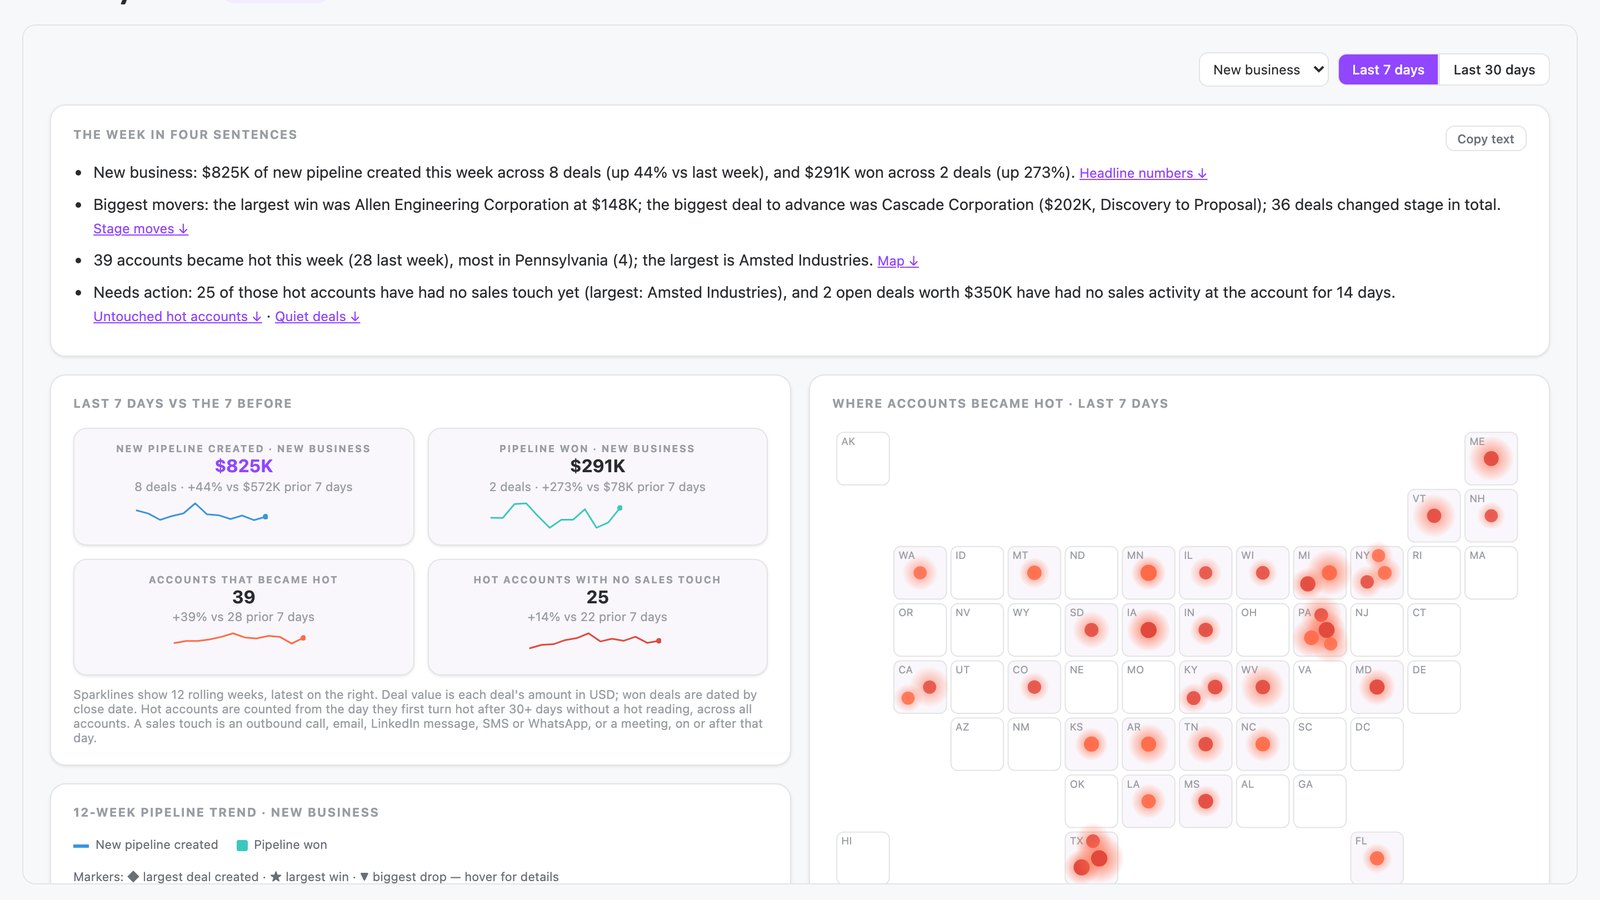
The CMO dashboard app is a shared N.Rich AI app, also called Monday read. It summarizes the last 7 days in four plain sentences. It then shows four headline numbers, a map of accounts that became hot, a 12-week pipeline trend and three deal lists.
Opens the live app on demo data. No sign-up needed. On your own N.Rich account, it reads accounts and deals from HubSpot or Salesforce.
- Four plain sentences A weekly summary of pipeline, biggest movers and actions, each linked to its evidence.
- Headline numbers and a map Four headline numbers with 12-week sparklines, next to a US map of accounts that became hot.
- A pipeline trend and deal lists A 12-week pipeline trend, plus lists of deals won, deals that moved stage and open deals with no activity in 14 days.
- Built for
- Marketing, Leadership
- Category
- Reporting
- Reads from
- N.Rich and your CRM (HubSpot or Salesforce)
- Built by
- N.Rich
- Cost
- Free on demo data. No credit card.
What questions does the CMO dashboard app answer?
What is a CMO dashboard?
A CMO dashboard is a single view of the numbers a chief marketing officer needs, such as pipeline created and pipeline won. It brings marketing and sales results into one place. That gives the CMO one version of the story for the weekly leadership conversation. The CMO dashboard app, also called Monday read, opens with four plain sentences on the last 7 days.
In the app: Summary sentencesHow can a CMO get a weekly pipeline update to forward to the CEO?
Write the week in a few plain sentences on pipeline created and won, the biggest movers and anything that needs action. Link each sentence to its evidence so the CEO can check it. A short, checkable summary saves a CMO from rebuilding the numbers every Monday. The CMO dashboard app writes this summary as four sentences, each linked to its evidence.
In the app: Summary sentencesWhat should I look for in an ABM dashboard for a CMO?
Look for a dashboard that leads with a short summary, then shows headline numbers, accounts that became hot and the deals that need attention. Each claim should link to its evidence. A CMO has little time, so the page must answer the main questions at the top. The CMO dashboard app adds a map of hot accounts, a pipeline trend and three deal lists.
In the app: The whole appHow can I see which accounts became hot this week and where they are?
Mark each account the first time it turns hot after a quiet spell, and plot it by location. A map shows where interest is growing this week. Regional leaders can then see where to act. The CMO dashboard app shows each account that became hot on a map, glowing brighter for accounts with more employees.
In the app: Map of hot accountsHow do I find hot accounts that sales has not touched yet?
Compare the list of hot accounts with the sales activity logged against each one. Any hot account with no call, email or meeting is waiting for a follow-up. Marketing and sales can then agree where to act first. The CMO dashboard app counts hot accounts with no sales touch in a headline number and shows them in red on the map.
In the app: Headline number and red glow on the mapHow do I spot open deals that have gone quiet?
List open deals with no logged activity for a set number of days. A deal that goes silent often needs a nudge before it slips. A weekly check keeps those deals in front of the team. The CMO dashboard app lists open deals with no activity in 14 days, next to deals won and deals that moved stage.
In the app: Deal lists
What data does the CMO dashboard app use?
From N.Rich
| Source | What the app reads | Where you see it |
|---|---|---|
| Website visits | The state where most of an account's visits come from | Position of each account on the map |
| Hot account readings | The day an account first turns hot after 30 or more days without a hot reading | Accounts that became hot headline number and the map |
From your CRM HubSpot or Salesforce
| Source | What the app reads | Where you see it |
|---|---|---|
| CRM deals | New pipeline created, pipeline won, deal value and stage moves | Headline numbers, pipeline trend and deal lists |
| CRM accounts | Employee count for each account | Glow brightness on the map |
| Sales activity | Calls, emails, LinkedIn messages, SMS, WhatsApp and meetings logged against each account | Hot accounts with no sales touch headline number and red glow on the map |
In the playground, every source holds demo data.
How does it work?
- You write one prompt, shown below. The Monday read app opens with four plain sentences that summarize the week. Each sentence links to its evidence further down.
- Four headline numbers compare the last 7 days with the 7 days before, each with a 12-week sparkline. They are new pipeline created, pipeline won, accounts that became hot, and hot accounts with no sales touch.
- A map shows each account that became hot. The prompt asks for a globe, or a map of one country. The demo accounts are all in the US, so the app draws a US map. Each account glows in its state, brighter for more employees, and red when it has no sales touch. A ranked list filters the page when you click an account.
- A 12-week trend shows new pipeline created as a line and pipeline won as bars. Markers show the largest deal created, the largest win and the biggest drop.
- Three lists show deals won, deals that moved stage, and open deals with no activity in 14 days. A switch changes the period between 7 and 30 days.
The prompt that built it
Prompt
I'm the CMO. Every Monday I need to know what changed in the last 7 days, and I want something I can forward to our CEO. Build me a 'Monday read' app. Start with three or four plain sentences that summarise the week: pipeline created and won, the biggest movers, and anything that needs action. Each sentence should link to the evidence further down. Under that, show four headline numbers, each with this week against last week and a 12-week sparkline: new pipeline created, pipeline won, accounts that became hot, and hot accounts with no sales touch. Next to them, put a slowly rotating globe where every account that became hot this week glows at its location, brighter for larger accounts (if all our accounts are in one country, use a map of that country instead); hovering a glow shows the account and what it did, and clicking it filters the lists below. Then show a 12-week pipeline trend with markers on the weeks where something notable happened, such as the largest deal created, the largest win or the biggest drop, each explained on hover. Finish with three short lists: deals won, deals that moved stage, and open deals with no activity in 14 days. Let me switch between the last 7 and the last 30 days.
Change the prompt to fit your team, then build your own in the N.Rich AI playground. Build your own
Before you start
Is it free?
Yes. Every app runs free in the N.Rich AI playground on demo data. You do not need a credit card.
Do I need my own data?
No. The playground runs on a demo dataset, so you can try the app before you connect your own data.
Which CRMs does it work with?
On your own N.Rich account, apps read accounts and deals from HubSpot or Salesforce.
Can I change it?
Yes. Ask N.Rich AI to add a column, change a filter or focus on one segment, and it rebuilds the app.