What is the ABM attribution app?
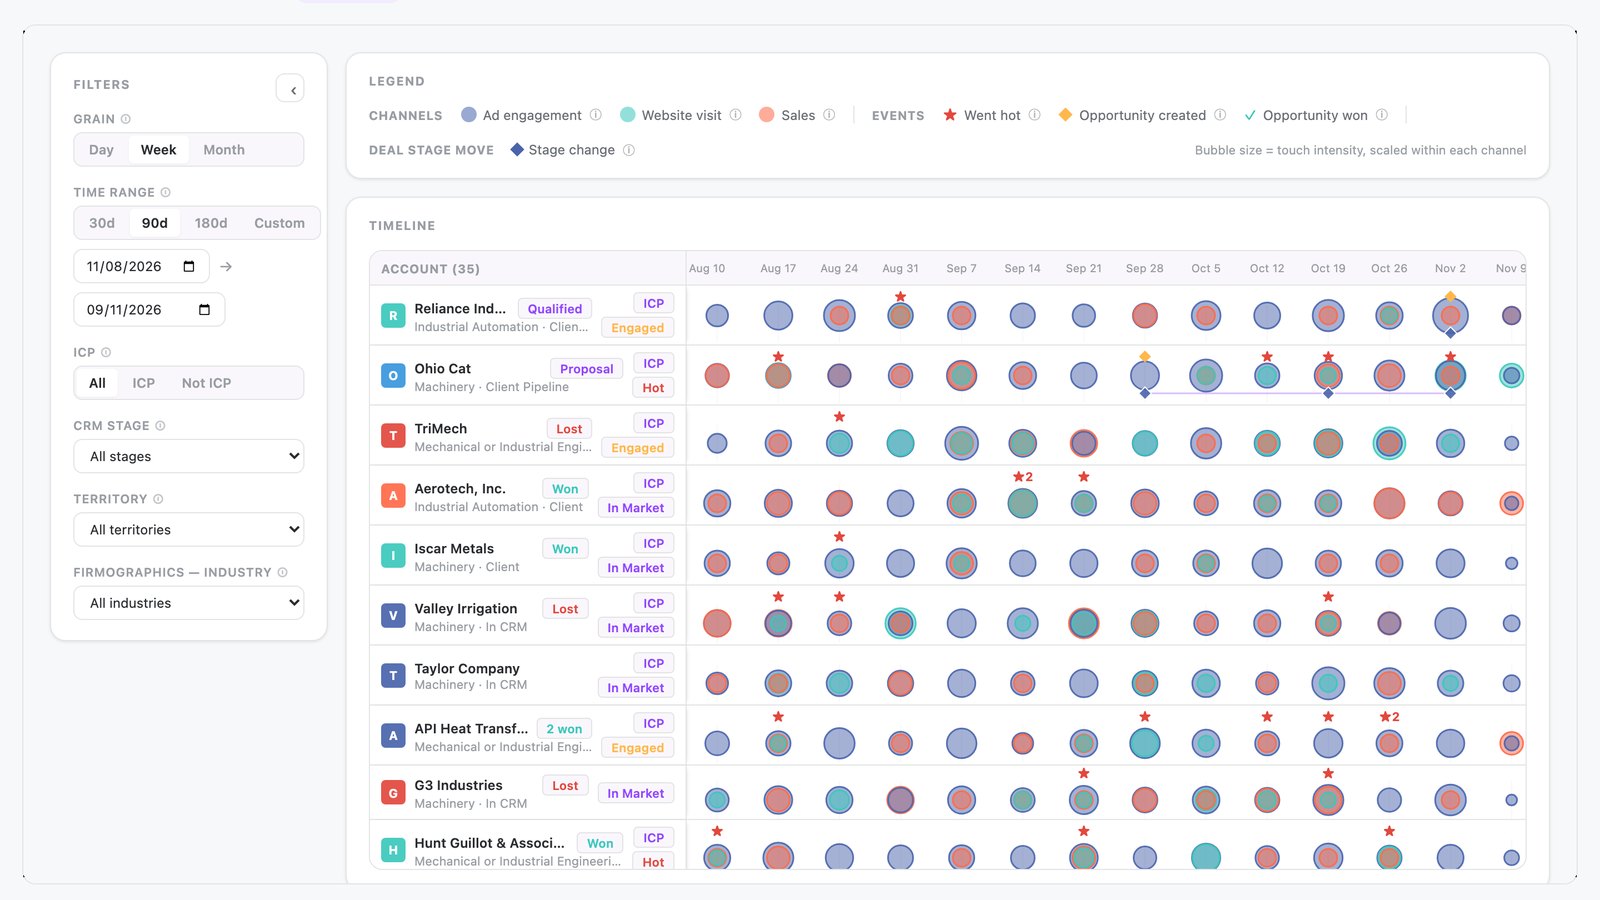
The ABM attribution app is built in N.Rich AI and plots the touches each account received over time. It shows ad engagement, website visits and sales outreach as bubbles on one timeline. Key events, such as going hot or winning a deal, appear on the same row.
It opens free in the N.Rich AI playground on demo data. On your own N.Rich account, it reads accounts and deals from HubSpot or Salesforce.
- An account timeline Ad, web and sales touches plotted per account, with filters for ICP, territory, industry and CRM stage.
- Account detail panels Ad creatives, website pages, sales activities, deal progression and channel breakdown for one account.
- Key events Intent changes, deal stage advances and events such as went-hot, opportunity created and won.
- Built for
- Marketing, Leadership
- Category
- Reporting
- Reads from
- N.Rich and your CRM (HubSpot or Salesforce)
- In the playground
- Account Attribution
- Cost
- Free on demo data. No credit card.
What questions does the ABM attribution app answer?
What is ABM attribution?
ABM attribution links the touches an account received to the deals it opened. It works at account level and covers ads, website visits and sales outreach. An ABM team needs that link to see what happened before a deal opened. The ABM attribution app plots those touches on one timeline for each account, with key events on the same row.
In the app: The whole appHow can I measure ABM impact without complex attribution?
Look at what happened at each account before the deal opened. A timeline of ad, web and sales touches, with deal milestones marked, gives a plain picture of the journey. ABM teams can then discuss each account's story without arguing over a credit formula. The ABM attribution app plots every ad, web and sales touch an account received on one timeline.
In the app: Account timelineHow do I see which touches an account received before a deal opened?
Line up each touch the account received from ads, website visits and sales outreach against the date the deal was created. The touches before that date show how the account was warmed. Sales and marketing can then agree on what happened. The ABM attribution app shows these touches as bubbles on the account's timeline, with a symbol marking the deal creation.
In the app: Account timelineWhat should I look for in ABM attribution software?
Look for attribution that works at account level and puts ads, website visits and sales outreach on one timeline. It should let you open one account and read its history. Buying decisions involve several people, so account-level history gives the fuller picture. The ABM attribution app plots all three touch types per account, with filters for ICP, territory, industry and CRM stage.
In the app: Account timeline and account panelHow can I see which channels engaged an account, such as ads, web or sales?
Split each account's activity by channel and by period. Ads, website visits and sales outreach each need their own view, so a team can see which channel carried the account. That keeps the wrong channel from taking the credit. The ABM attribution app splits the three channels in its account panel, including LinkedIn engagement and reach and paid and organic website visits.
In the app: Account panelHow can I see what happened after an account went hot?
Mark the date an account's intent level rose, then follow the touches, deal creation and stage moves that come after. The sequence shows whether sales and marketing acted on the signal. ABM teams use it to find gaps between a signal and a response. The ABM attribution app marks went-hot events as symbols on each account's row, next to later touches and stage moves.
In the app: Event symbols on the timeline
What data does the ABM attribution app use?
From N.Rich
| Source | What the app reads | Where you see it |
|---|---|---|
| N.Rich advertising | Ad creatives, plus ABM engagement and reach | Timeline bubbles; ad creatives in the account panel |
| Website visits | Pages visited, split into paid and organic | Timeline bubbles; pages visited in the account panel |
| N.Rich intent | Intent level changes for each account | Event symbols on the timeline |
From your CRM HubSpot or Salesforce
| Source | What the app reads | Where you see it |
|---|---|---|
| Sales activity | Logged calls, emails and LinkedIn touches | Sales bubbles on the timeline; logged touches in the account panel |
| CRM deals | Deal stage progression, deals created and deals won | Event symbols on the timeline; deal progression in the account panel |
In the playground, every source holds demo data.
How does it work?
- The app plots each account on a timeline, grouped by day, week or month.
- Bubble size shows how much ad engagement, website activity and sales outreach the account had in each period.
- Symbols and diamonds mark events on each row, such as intent level changes, deals created, deals won and stage moves.
- You filter by ICP match, CRM stage, territory, industry and date range. You then open an account to see the ad creatives, pages visited, logged calls, emails and LinkedIn touches, and deal progress.
Make it yours
Type a request and N.Rich AI rebuilds the app. Teams often start with one of these.
- Show the timeline by month
- Show only ICP accounts in one territory
- Hide sales activity so I see only ad and web touches
- Filter to one industry
Before you start
Is it free?
Yes. Every app runs free in the N.Rich AI playground on demo data. You do not need a credit card.
Do I need my own data?
No. The playground runs on a demo dataset, so you can try the app before you connect your own data.
Which CRMs does it work with?
On your own N.Rich account, apps read accounts and deals from HubSpot or Salesforce.
Can I change it?
Yes. Ask N.Rich AI to add a column, change a filter or focus on one segment, and it rebuilds the app.