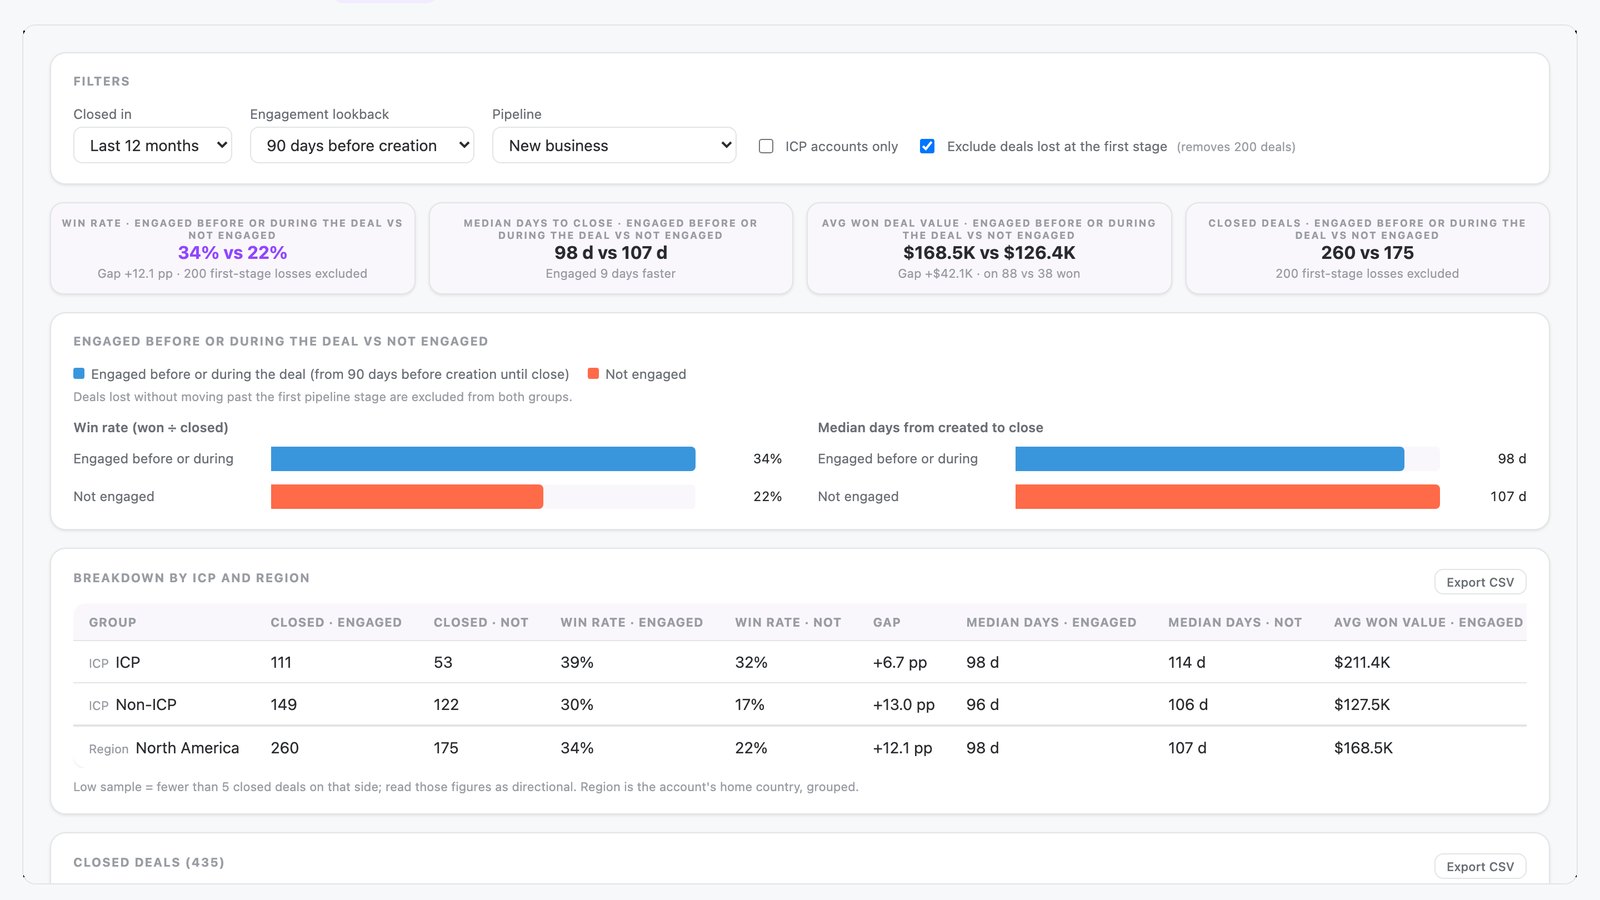
What is the win rate by engagement app?
The win rate by engagement app is built in N.Rich AI and compares closed deals with and without prior engagement. It shows win rate, median days to close and average deal value for each group. A team sees whether engagement goes with better outcomes.
It opens free in the N.Rich AI playground on demo data. On your own N.Rich account, it reads accounts and deals from HubSpot or Salesforce.
- Engagement and deal outcomes Closed deals with documented engagement, compared with closed deals without it.
- Win rate and cycle by segment Win rate, median days to close and average deal value, grouped by ICP status and region.
- Touched and untouched deals Engagement means an ad interaction or a site visit from the account within a lookback period you set.
- Built for
- Marketing, Leadership
- Category
- Pipeline & revenue
- Reads from
- N.Rich and your CRM (HubSpot or Salesforce)
- In the playground
- Touched vs untouched
- Cost
- Free on demo data. No credit card.
What questions does the win rate by engagement app answer?
What is win rate by engagement?
Win rate by engagement compares the win rate of closed deals whose accounts engaged with marketing against closed deals whose accounts did not. It shows whether engaged accounts win more often. ABM teams use it to judge whether their engagement work goes with better outcomes. The win rate by engagement app shows both groups with median days to close and average deal value.
In the app: The whole appHow can I tell whether ABM engagement improves win rate?
Split your closed deals into those whose accounts engaged before the deal and those that did not. Then compare the win rates of the two groups. The gap shows whether engagement goes with better results. The win rate by engagement app compares touched and untouched deals and groups the results by ICP status and region.
Do accounts that engage with marketing close deals faster?
Compare the median days to close for deals whose accounts engaged with the median for deals whose accounts did not. A shorter median for the engaged group points to a faster sales cycle. Faster cycles free sales capacity sooner. The win rate by engagement app shows median days to close for both groups and filters by time window, lookback, pipeline and deal stage.
What counts as engagement when I compare won and lost deals?
Define engagement before you compare. Choose which touches count, such as ad interactions or site visits, and set a lookback period before the deal. Without a fixed definition, two teams can count the same deal differently. The win rate by engagement app counts an ad interaction or a site visit from the account within a lookback period you set.
What should I look for in ABM reporting that links engagement to win rate?
Look for reporting that compares closed deals with and without engagement, uses a lookback period you can change and breaks results out by segment. It should also show deal value and sales cycle length. These views keep one overall win rate from hiding differences between segments. The win rate by engagement app groups results by ICP status and region.
Does engagement prove that marketing caused a win?
A comparison of two groups of deals shows whether engagement and outcomes move together. It cannot show that one caused the other. An ABM team should present the result as a pattern and avoid claiming credit for every win. The win rate by engagement app compares touched and untouched deals and does not prove cause.
What data does the win rate by engagement app use?
From N.Rich
| Source | What the app reads | Where you see it |
|---|---|---|
| N.Rich advertising | Ad interactions that count as engagement | Touched and untouched groups |
| Website visits | Site visits from the account that count as engagement | Touched and untouched groups |
From your CRM HubSpot or Salesforce
| Source | What the app reads | Where you see it |
|---|---|---|
| CRM deals | Closed deals, pipeline, stage, deal value and days to close | Win rate, days to close and deal value for each group |
| CRM accounts | ICP status and region | ICP status and region groups |
In the playground, every source holds demo data.
How does it work?
- The app compares closed deals that had documented engagement with closed deals that did not. Engagement means an ad interaction or an identified site visit within a lookback period you set.
- It groups the results by ICP status and region.
- For each group it shows win rate, median days to close and average deal value.
- You filter by time window, engagement lookback, pipeline and deal stage.
Make it yours
Type a request and N.Rich AI rebuilds the app. Teams often start with one of these.
- Change the engagement lookback to 60 days
- Show results for one pipeline only
- Break the results out by region
- Count only ad interactions as engagement
Before you start
Is it free?
Yes. Every app runs free in the N.Rich AI playground on demo data. You do not need a credit card.
Do I need my own data?
No. The playground runs on a demo dataset, so you can try the app before you connect your own data.
Which CRMs does it work with?
On your own N.Rich account, apps read accounts and deals from HubSpot or Salesforce.
Can I change it?
Yes. Ask N.Rich AI to add a column, change a filter or focus on one segment, and it rebuilds the app.