What is the ABM funnel analytics app?
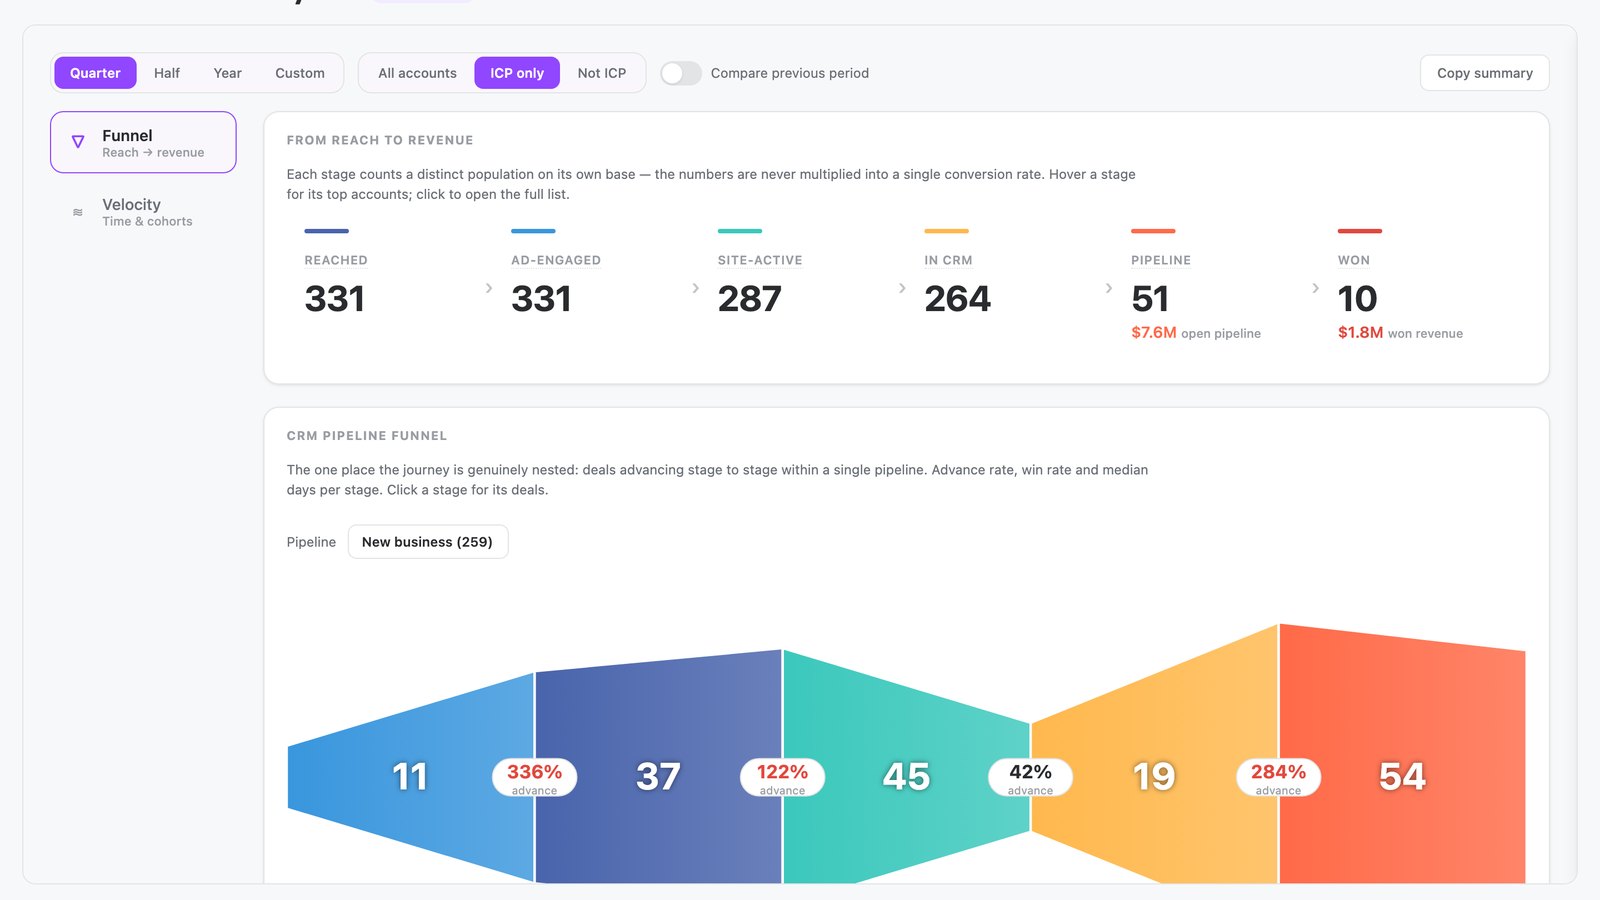
The ABM funnel analytics app is built in N.Rich AI and shows the full account journey from first touch to won revenue. It follows accounts through reach, ads, site activity and CRM matching. It then follows deals through pipeline stages.
It opens free in the N.Rich AI playground on demo data. On your own N.Rich account, it reads accounts and deals from HubSpot or Salesforce.
- An account journey Reach, ad engagement, site activity, CRM matching and pipeline through to closed deals.
- A CRM pipeline funnel Stage-by-stage conversion rates, win rates and median deal velocity.
- Cohort analysis Cohorts by entry quarter show which pipeline stages deals eventually reach.
- Built for
- RevOps, Leadership, Marketing
- Category
- Pipeline & revenue
- Reads from
- N.Rich and your CRM (HubSpot or Salesforce)
- In the playground
- Account Funnel Analytics
- Cost
- Free on demo data. No credit card.
What questions does the ABM funnel analytics app answer?
What is ABM funnel analytics?
ABM funnel analytics tracks target accounts through each stage of the journey, from first reach to closed revenue. It shows where accounts progress and where they stall. A team needs that view because account progress starts before deals appear in the CRM. The ABM funnel analytics app shows the account journey first and then a CRM pipeline funnel for deals.
In the app: The whole appWhat are the stages of an ABM funnel?
An ABM funnel usually runs from reach to engagement, then to pipeline and closed revenue. Each stage counts accounts. Counting accounts gives marketing and sales one shared unit. The ABM funnel analytics app shows accounts moving through reach, ad engagement, site activity and CRM matching, then follows deals through pipeline stages.
In the app: Account journeyWhich ABM metrics should I track from first touch to closed deal?
Track how many accounts reach each stage, how many deals convert between stages and how fast deals move. Add win rate by stage to see where deals are lost. These measures tie marketing activity to revenue. The ABM funnel analytics app shows stage-by-stage conversion rates, win rates and median deal velocity, with an optional prior-period comparison.
In the app: CRM pipeline funnelHow do I find where deals drop out of my pipeline?
Measure the share of deals that move from each pipeline stage to the next. The stage with the largest fall shows where deals drop out. Finding that stage lets a team fix it before more deals stall there. The ABM funnel analytics app shows conversion and win rates for each stage. A click on a stage opens a sortable list of its deals.
In the app: CRM pipeline funnelWhat should I look for in ABM analytics software?
Look for analytics that count accounts at each stage, follow deals through your CRM pipeline and let you open the records behind every number. It should also show how fast deals move. These views let marketing and sales trace any figure back to its accounts. The ABM funnel analytics app gives each step its own account count, then a CRM funnel with velocity and cohort views.
In the app: Stage listsHow can I measure how fast deals move through the pipeline?
Measure the median days that deals spend in each stage. Group deals into cohorts by the quarter they entered the pipeline, and check which stages each cohort reaches. A slow stage shows an ABM team where deals wait longest. The ABM funnel analytics app shows a velocity view with median days in each stage and cohort tables by entry quarter.
In the app: Velocity view and cohort tables
What data does the ABM funnel analytics app use?
From N.Rich
| Source | What the app reads | Where you see it |
|---|---|---|
| N.Rich advertising | Reach and ad engagement for each account | Reach and ad engagement steps in the account journey |
| Website visits | Site activity for each account | Site activity step in the account journey |
From your CRM HubSpot or Salesforce
| Source | What the app reads | Where you see it |
|---|---|---|
| CRM accounts | Account matching and ICP membership | CRM matching step; ICP membership filter |
| CRM deals | Pipeline stages, win rates and days in each stage | CRM pipeline funnel and velocity view |
In the playground, every source holds demo data.
How does it work?
- The app shows accounts moving through reach, ad engagement, site activity and CRM matching. Each step counts its own accounts.
- It then follows deals through CRM pipeline stages, with conversion and win rates for each stage.
- You filter by date range, ICP membership and pipeline. You can compare with the prior period.
- You click a stage to open a sortable list of accounts or deals for export. A velocity view shows median days in each stage, and cohort tables show which stages deals reach by entry quarter.
Make it yours
Type a request and N.Rich AI rebuilds the app. Teams often start with one of these.
- Compare this quarter with the previous quarter
- Show only ICP accounts
- Show one pipeline at a time
- Group the cohorts by entry month
Before you start
Is it free?
Yes. Every app runs free in the N.Rich AI playground on demo data. You do not need a credit card.
Do I need my own data?
No. The playground runs on a demo dataset, so you can try the app before you connect your own data.
Which CRMs does it work with?
On your own N.Rich account, apps read accounts and deals from HubSpot or Salesforce.
Can I change it?
Yes. Ask N.Rich AI to add a column, change a filter or focus on one segment, and it rebuilds the app.