Introduction
ABM Progression Analytics helps you track where your accounts are in their buying journey and inform your sales and marketing efforts based though account analytics that:
- Shows you where your accounts are in their buying journey
- Identifies which accounts are heating up or cooling down based on engagement levels
- Tracks weekly progression of accounts through the buying journey
- Shows you open opportunities at each stage
- Displays topics of interest to accounts, along with their combined first-party and third-party engagement scores
Key Benefits:
- Provides actionable insights for sales and marketing teams to engage accounts at the right time.
- Enhances the effectiveness of your ABM programs by showing which efforts are driving account progression.
- Helps prioritize account-based advertising strategies by distinguishing between accounts in the awareness stage and those ready to make a purchase.
- Offers comparison reports to demonstrate the impact of ABM activities to stakeholders.
Prerequisites
- Feature available to Lite, Growth & Enterprise plan users.
- Existing Intent Report (Buyer Journey or Hot Demand)
An intent report report is essential for the analytics to function properly. You can create a Hot Demand or Buyer Journey Intent Report by navigating to Intent Reports -> New Intent Report and selecting the Hot Demand or Buyer Journey use case on the first page of the setup wizard. Please read this article if you are new to intent reports.
Please read the best practices section of this document to learn how to setup your Intent Reports optimally for Progression Analytics.
Getting Started
To access the ABM Progression Analytics feature, in the N.Rich navigation header menu, click on “Analytics”, then “Progression analytics” menu item.
To view progression analytics for a specific Intent Report, select the Intent Report under the first dropdown available.

The feature will then populate Buyer Progression Analytics as shown in the screenshot above. Users will be able to see on this tab the Buyer's Journey Analytics, Opportunity Analysis and an Account List.
Using the Buyer Journey View
- What It Does:
Visualization of how many accounts are advancing or regressing in the buying journey across the different stages. - Step-by-Step Instructions:
- Navigate to the ABM Progression Analytics section in the N.Rich platform.
- Select your Intent Report.
- The Buyer Journey Analytics will be populated accordingly.
- Review the stages to identify the movement of accounts.
- Click on "In Market", "Engaged" or "Hot" stage to see all accounts in each stage.
- Click on the number on the right side to see only the accounts that progressed or regressed in each stage.
- Use the insights to determine next steps for your marketing or sales outreach.
Understanding the Account Funnel in Progression Analytics
The Account Funnel visualization provides a clear breakdown of how accounts move through different buyer journey stages over a selected time frame. This allows users to track account progression, regression, and engagement shifts at a glance.
Using the Account Funnel UI
The funnel is divided into different sections, each representing a buyer journey stage. The color-coded sections provide insights into total accounts in a stage, accounts that moved into a stage, and accounts that moved away from a stage.
1. Viewing All Accounts in a Stage
Clicking on the soft-colored section (e.g., light green) filters analytics to show all accounts that currently exist in the selected stage during the specified time frame. This view helps you analyze the total volume of accounts within a given stage, whether they were already there or moved in.
2. Viewing Accounts That Moved Into a Stage
Clicking on the solid-colored section (e.g., dark green) filters analytics to show only the accounts that moved into the selected stage within the time frame. These accounts could have moved from any previous stage (progressed) or reverted from a later stage (regressed). The tooltip displays a breakdown of how many accounts moved to this stage and their previous stage.
You can interact with the tooltip to see details of specific accounts.
3. Viewing Accounts That Left a Stage
Clicking on the greyed-out section at the bottom of a stage filters analytics to show only the accounts that moved away from this stage during the time frame. These accounts could have progressed to a later stage or regressed to an earlier stage.
Additional Interactions & Insights
- When interacting with a stage (soft color, solid color, or greyed-out section), the account list table title will update dynamically to reflect the specific set of accounts being displayed.
- Clicking on a solid-colored section brings up a tooltip displaying the exact number of accounts that moved to that stage.
Using the Opportunity Analysis (HubSpot Only)
- What It Does:
Provides the conversion rate to opportunities at each stage. The number is computed by looking at all opportunities from accounts at this stage over all the accounts that had sales engagements over the last 90 days, for the same stage. Sales engagements include Call Logged, Email Sent, Email Reply and Meeting Set events in HubSpot. - Prerequisites:
1. Users need to have their HubSpot CRM Integration enabled
2. Users need to enable the following CRM Setting: "Pull opportunity and events data from HubSpot".
Using the Journey Stage-Based Account Segmentation
In the top left had corner of the feature page, you will find a button named "Create Progression Workflow":

This will open up a workflow creation wizard enabling you to create account segments for any of the Journey Stages (Cold, In-Market, Engaged and Hot). This effectively segments the target accounts in your intent report based on their buyer journey stage and will keep the segments in sync, replicating account movements to and from specific stages. This is executed through Workflows.

Using the Weekly View
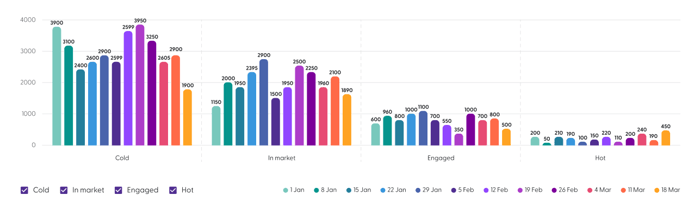
- What It Does:
The Weekly View provides a week-by-week visualization of account progression through the buying stages. - Step-by-Step Instructions:
- On the upper right hand side corner of the page, switch from "Compare two dates" to "View week by week" view.
- The feature will populate a week by week chart showing the total number of accounts in each stage and how they are progression week over week
- Chart Interaction:
- You can select the stages you are interested in seeing by using the stage selectors at the bottom of the chart.
- You can change the date range comparison by interacting with the "Compare range" dropdown selection.
Using Date Range Comparison
Use the “Compare range” selectors to narrow down on a weekly date range you want to see analytics for. The first selector enables you to select the furthest week you want to compare the base week range (second selector) against.
For example, in the screenshot below, we are comparing last week’s data against the data from 3 weeks ago and can see that 5 accounts moved from Engaged to Hot.
.png?width=688&height=253&name=image-mh%20(10).png)
Interpreting Engagement Scores:
- What They Mean:
Engagement scores combine first-party and third-party data to indicate the level of interest an account has in your offerings. Since the Intent Report used as source are based predominantly on first-party data, the analytics (and progression criteria) will be inherently based mostly on first-party engagements. Below are the engagement thresholds for the accounts to move from one stage to another.
Stage Stage threshold Score threshold Characteristics Cold No intent or engagements (1st or 3rd-party) Less than 0 Minimal engagement, low likelihood of immediate conversion. In Market Mandatory 3rd-party intent signals Less than 30 Early research phase, showing signals of potential interest. Engaged Mandatory ABM ad engagements Between 30 and 60 Actively interacting with sales and marketing content Hot Mandatory quality website engagements
Greater than 60 Strong intent, direct sales engagement, and high likelihood of conversion. - How to Use Them:
- Review the engagement scores for each account.
- Prioritize accounts with high scores for immediate follow-up.
- Monitor lower scores to determine if additional nurturing or different tactics are needed.
Best Practices
Buyer Journey Intent Report Setup & ABM Nurture Campaigns
To make the most out of the progression analytics feature, it's best to use an intent report that includes segments you are actively advertising to. Since the progression is based mainly on first-party engagements, seeing analytics for the accounts you are advertising to will help you understand how successful your ABM program is at driving accounts to convert. Our recommendation is to setup a Buyer Journey Intent Report, which is more suited for this objective.
Please also read our Guide to creating ABM nurture campaigns here, to learn how to orchestrate ABM nurture campaigns using segments created from your Intent Report.
Once you have this setup, you can create an Intent Report that use the segments you created for your nurture program and use Progression Analytics to understand how your ABM program is performing and where to focus your efforts (building more awareness vs driving purchase decisions).
FAQ
Why I can’t see any intent reports to choose from?
Cause: No Hot Demand Intent Report have been set up.
Solution: Make you that you have set up an Intent Report using the Hot Demand preset which sets the Intent Report to use mainly first-party data engagement sources (80% first-party weight).
Why no accounts are showing up in the Buyer Journey View or Weekly View?
Cause: The Hot Demand Intent Report may not be set up correctly.
Solution: Double-check the setup of your Intent Report and ensure it is generating data.
Why the Engagement scores seem inaccurate or outdated?
Cause: Data synchronization issues or outdated third-party data.
Solution: Contact your CSM to verify the data sources and ensure they are up-to-date.